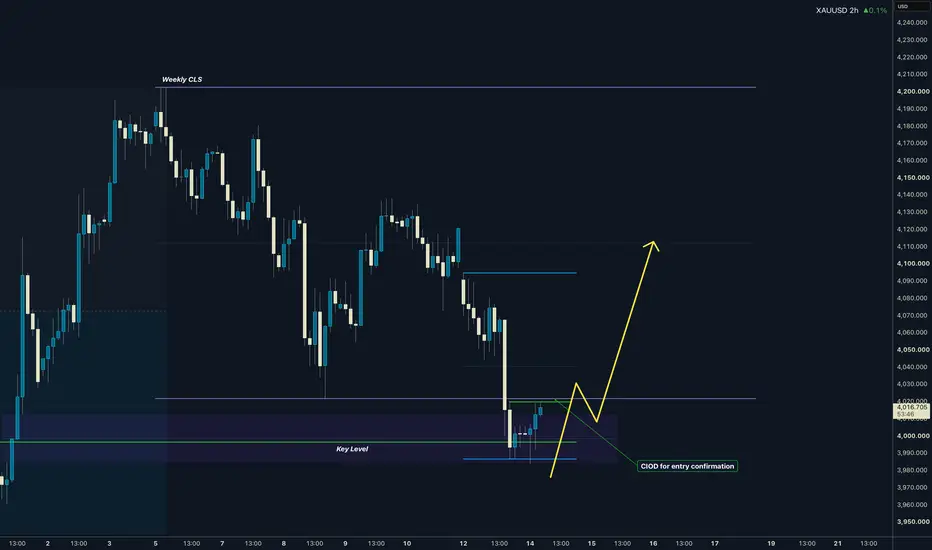
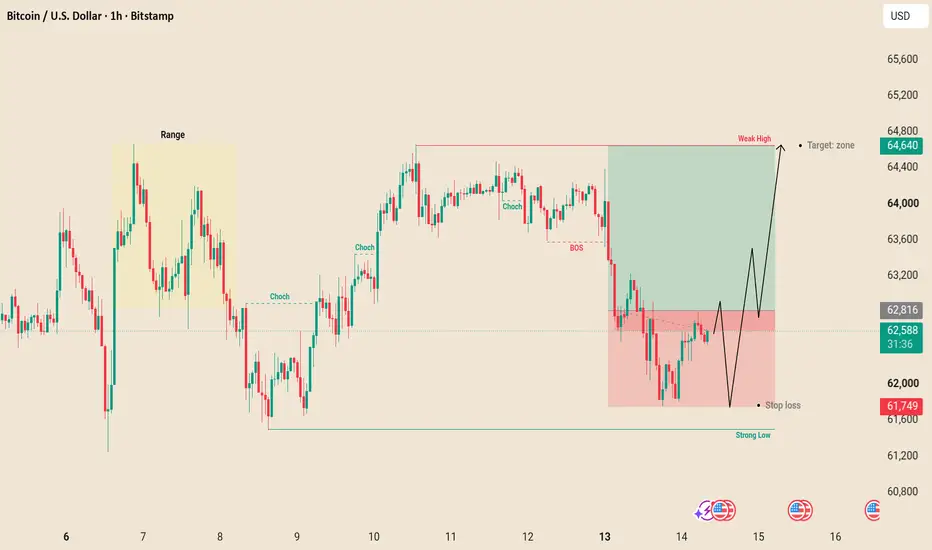
Long
Long
Long 
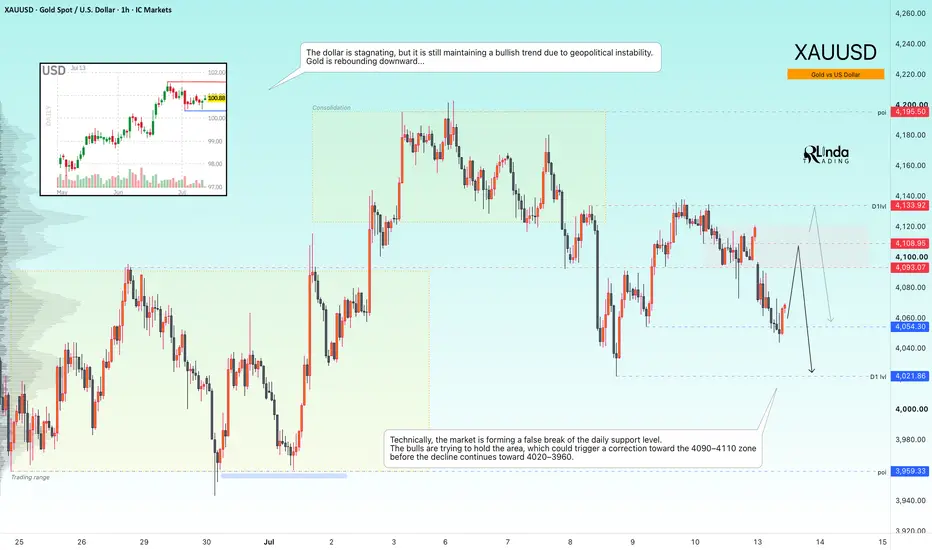
GOLD - A countertrend correction before a decline FX:XAUUSD has reversed lower from the 4120–4133 resistance zone—exactly the scenario we had been anticipating since the end of last week—and is now testing the 4050 support area while forming a false breakout. The fundamental and geopolitical backdrop remains weak, suggesting that the broader decline may continue
Gold fell sharply on Monday, breaking below the $4100 level as renewed tensions in the Middle East boosted the U.S. dollar. Although the dollar is currently consolidating, it remains in a broader bullish trend, supported by ongoing geopolitical uncertainty. The overall market remains under bearish pressure, with the technical outlook still negative. The next major catalysts will be the U.S. CPI report, Fed Chair Warsh's speech, and further developments in the Middle East.
Drivers:
Bearish for gold: Escalation of the conflict (strengthening the U.S. dollar while pushing oil prices and inflation higher), Hawkish Fed signals, Strong U.S. inflation data
Bullish for gold: Geopolitical de-escalation, Weaker-than-expected CPI data, Dovish comments from Warsh
Resistance levels: 4093, 4108, 4133
Support levels: 4054, 4021
Technically, the market is forming a false breakout below the daily support level. Bulls are attempting to defend the area, which could trigger a corrective rebound toward the 4090–4110 interest zone before the broader downtrend resumes toward 4020–3960
Best regards,
R. Linda Short 
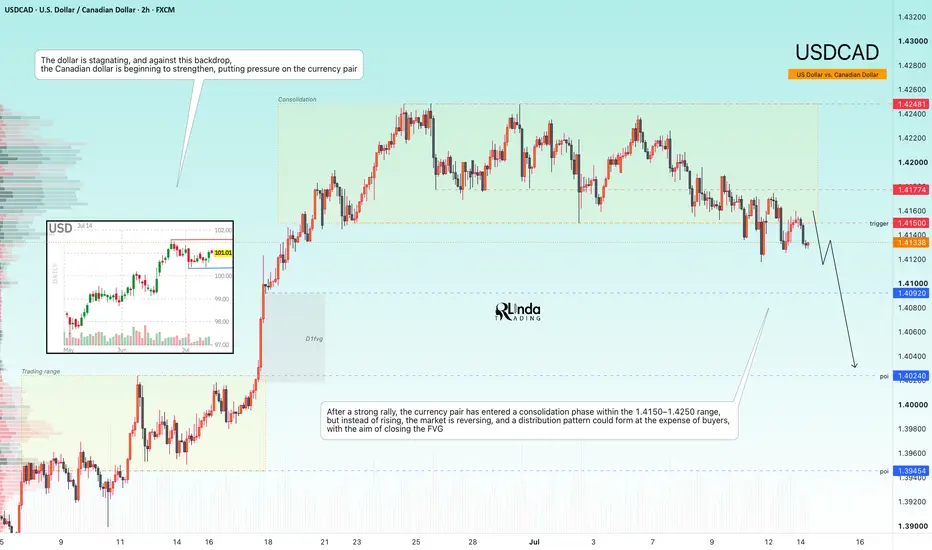
USDCAD - From consolidation to downward distributionFX:USDCAD is forming a reversal pattern following its recent strong rally. The market appears to be transitioning from a consolidation phase into a distribution phase
The U.S. dollar has entered a period of consolidation, while the Canadian dollar is beginning to strengthen, putting additional pressure on the pair.
After the strong advance, USDCAD moved into a 1.4150–1.4250 trading range. Instead of continuing higher, price is now showing signs of a reversal. Buyer participation may lead to a distribution phase, with the market potentially moving lower to fill the existing fair value gap (FVG)
Resistance levels: 1.4150, 1.4177
Support levels: 1.4092, 1.4024
Technically, after breaking below the consolidation support, bears are attempting to keep the price below the 1.4150 range boundary. As long as this level remains under sellers' control, the market may continue its decline toward 1.4092 and 1.4024
Best regards,
R. Linda  Long
Long
XAUUSD: Fake Breakout Signals Fresh Bearish Pressure, Aim 3,980$Hello everyone, here is my breakdown of the current XAUUSD setup.
Market Analysis
XAUUSD previously traded inside a broad descending channel before forming a Rounding Top, confirming a bearish continuation. After breaking below the triangle support, price accelerated lower and later found support near the 3,980 Support Zone.
Currently, XAUUSD is trading above the 3,980 Support Zone while remaining below the 4,150 Resistance Zone. A recent fake breakout above the descending trendline failed to attract buyers, suggesting sellers remain in control.
My Scenario & Strategy
As long as XAUUSD remains below the 4,150 Resistance Zone and continues to respect the descending trendline, the bearish scenario remains valid. A rejection from current levels could push price back toward the 3,980 Support Zone (TP1).
However, if XAUUSD breaks above the descending trendline and secures a move above the 4,150 Resistance Zone, the bearish outlook would weaken and a stronger bullish recovery could develop.
That’s the setup I’m tracking. Thank you for your attention, and always manage your risk. Short 
XAU/USD | Gold May Correct First, Then Continue To Fall! By analyzing the #Gold chart on the 2H timeframe, we can see that after last week’s analysis, price continued moving lower and has already reached the $4003 region. In my view, this bearish move is not finished yet. I still expect stronger downside pressure today or tomorrow, and Gold may soon break below the psychological $4000 level.
Before that happens, we may first see a minor corrective move higher to fill part of the liquidity void created during the recent decline. After this correction, sellers could step in again and push price toward lower levels. The key downside areas to monitor are $3985 – $3990 , followed by $3959 – $3979 , and then the important $3940 level.
For now, the main bias remains bearish , but price reaction around these levels will be very important for the next move.
Please support me with your likes and comments to motivate me to share more analysis with you and share your opinion about the possible trend of this chart with me !
Best Regards , Arman Shaban Short 
Some Opportunities Improve By Being MissedMissing a move is one of the most frustrating experiences in trading.
The market moves exactly as expected, the analysis proves correct, and yet the trader never finds a way to participate. The natural reaction is regret. The assumption is that an opportunity was lost.
Sometimes that assumption is wrong.
Not every missed trade is a mistake.
Many missed opportunities reveal something valuable about the quality of the setup itself. If entering required chasing price, abandoning risk management, or violating predefined rules, then missing the trade may have been the correct decision even if the move ultimately worked.
This distinction is important because traders often evaluate decisions based solely on outcome.
A missed winner feels like failure. A poorly executed trade that generates profit feels like success.
Neither conclusion is necessarily accurate.
The purpose of a trading framework is not to capture every move. It is to participate selectively in moves that fit predefined criteria. Any opportunity that requires abandoning those criteria carries hidden costs, even if it succeeds.
Missing trades also provides information.
It reveals weaknesses in preparation, execution, or patience. Perhaps the setup was identified too late. Perhaps the entry plan was incomplete. Perhaps the trader hesitated unnecessarily. These lessons remain valuable regardless of whether the move was missed.
The real danger comes afterward.
Many traders attempt to compensate immediately by chasing the move or forcing the next opportunity. This transforms a harmless missed trade into an expensive emotional decision.
Experienced traders understand that opportunities are not rare events.
Markets continuously generate new situations where structure, liquidity, and participation align. Missing one does not eliminate future opportunity.
The objective is consistency.
Sometimes the trade that was missed creates more long-term value than the trade that was taken. Final Corrective Wave Maturing? XAUUSD | Higher-Timeframe Correction Near Completion, But Bulls Still Need Confirmation
Gold remains inside a broader higher-timeframe corrective structure, but the current price action is showing characteristics of a late-stage correction rather than the beginning of a new bearish expansion.
On the 2H timeframe, the latest bearish leg has developed into a move comparable in magnitude to the previous downside impulse. This symmetry is important because corrective structures often complete when price reaches proportional extensions relative to previous legs, especially when combined with exhaustion signals.
At the current stage, the market appears to be approaching the lower boundary of the corrective structure, suggesting that the final corrective wave may be close to completion.
However, the key factor is not only price — it is also time.
The correction has already consumed a significant amount of time after the previous bullish expansion. This indicates that the market has potentially completed a large part of its time-based rebalancing process.
Time correction does not automatically create a reversal, but when combined with price exhaustion, liquidity collection, and weakening downside momentum, it increases the probability that the corrective phase is entering its final stage.
---
Structural Context
The current decline should still be classified as a correction until proven otherwise.
Although the downside move is showing signs of exhaustion, the market has not yet delivered the required confirmation:
No confirmed bullish Market Structure Shift (MSS).
No decisive Break of Structure (BOS) above the relevant swing highs.
No clear impulsive displacement indicating aggressive buyer participation.
Therefore, the current thesis is not an immediate trend reversal call.
The expectation is that the market is approaching an area where a bullish transition could develop, but confirmation remains mandatory.
---
15M Lower-Timeframe Context | Liquidity Sweep + Potential Accumulation
The lower timeframe structure provides a more constructive setup.
On the 15M timeframe, price has already:
Swept sell-side liquidity beneath recent lows.
Traded into discounted pricing areas.
Shown signs of declining bearish momentum.
Developed bullish reactions around demand zones.
This suggests that downside liquidity may have already been collected, reducing the probability of a straightforward continuation lower without a corrective reaction.
However, liquidity sweep alone is not sufficient confirmation.
The market still needs to prove that buyers are capable of taking control through structural change.
The preferred scenario is not chasing the first bullish reaction.
The ideal setup would be:
A final retracement into the 15M OTE / demand area.
Formation of a higher low.
Bullish MSS followed by displacement.
Continuation toward higher-timeframe liquidity targets.
---
Macro Context
The recent pressure on gold has mainly been associated with USD strength and shifting expectations around U.S. monetary policy.
USD Channel:
A stronger dollar has created headwinds for gold because XAUUSD is negatively correlated with USD strength. Any renewed dollar expansion could delay the completion of the corrective structure.
Real Yields Channel:
Higher real yields reduce the attractiveness of non-yielding assets such as gold. A stabilization or decline in real yields would provide a supportive environment for a bullish gold recovery.
Risk Sentiment Channel:
Current price action does not represent a pure risk-off gold bid. The decline has been more consistent with USD repricing and positioning adjustments rather than aggressive safe-haven demand.
Liquidity Channel:
The recent downside move appears to have functioned partially as a liquidity event, clearing weak long positions and collecting sell-side liquidity before the next directional expansion.
The structural driver remains the broader monetary and central-bank uncertainty, while the short-term move appears dominated by positioning and technical correction dynamics.
---
Liquidity & Order Flow Interpretation
The recent decline shows characteristics of a corrective displacement rather than a fresh bearish trend initiation.
Current observations:
Sell-side liquidity has been targeted below local lows.
The move appears closer to liquidation/position adjustment than aggressive new short positioning.
Price is attempting to stabilize after completing a deeper corrective leg.
The important distinction:
A continuation below the liquidity sweep with acceptance would indicate that sellers remain in control.
A rejection from this area followed by bullish displacement would suggest that the liquidity event has completed and buyers are entering.
---
Scenario 1 — Bullish Continuation Scenario
Conditions Required:
Price maintains acceptance above the recent liquidity sweep zone.
The 15M structure forms a higher low.
Buyers create bullish MSS/BOS.
Momentum expands through displacement rather than slow grinding.
Confirmation Trigger:
Break and hold above the latest lower-timeframe supply/swing high.
Successful retest confirming demand.
Targets:
Internal liquidity above recent highs.
Premium areas of the current corrective range.
Higher-timeframe supply zones.
Invalidation:
Acceptance below the liquidity sweep low.
Failure to create bullish structure after reaction.
---
Scenario 2 — Bearish Continuation Scenario
Conditions Required:
Demand zone fails to hold.
Price accepts below the current corrective boundary.
No bullish MSS develops.
Confirmation Trigger:
Strong bearish displacement after breaking the recent low.
Continuation without immediate reclaim.
Expectation:
The higher-timeframe correction remains incomplete.
Another bearish leg develops toward external liquidity below.
Invalidation:
Strong reclaim of broken structure with bullish displacement.
Failure of sellers to continue after the liquidity break.
---
Final Market View
Primary Driver: Higher-timeframe corrective exhaustion approaching completion after a proportional bearish leg.
Secondary Driver: 15M sell-side liquidity sweep and weakening downside momentum.
Market Regime: Corrective consolidation transitioning toward a potential liquidity-driven expansion.
Current Tactical Stance: Cautiously bullish, but waiting for structural confirmation before assuming a new impulsive bullish phase.
The current setup suggests that gold may be preparing for the next bullish expansion cycle, but the market is still in the confirmation phase. The key event is not the liquidity sweep itself — it is whether buyers can convert that liquidity event into a confirmed market structure shift.
XAUUSD: ABC Recovery Is Forming After the Elliott Drop
Gold is trying to recover after completing a sharp bearish Elliott wave sequence near the lower price area. From Kelly’s view, the market has already reacted from the recent low, but the current move still looks more like an ABC corrective recovery rather than a confirmed bullish reversal.
The key idea is simple: gold may continue to rebound in the short term, but the reaction around each resistance zone will decide whether buyers can keep control.
⟡ Market structure
The chart shows gold previously moved in a strong bearish sequence, creating lower highs and lower lows before reaching the final wave 5 area near the lower base. After that, price started to recover and is now forming a short-term ABC structure.
Price is currently trading around 4,027, close to the small sell zone near 4,038. If gold can hold above the buy wave C area around 4,011, the recovery may continue towards the higher reaction zones.
The important resistance above is the Elliott wave completed sell zone around 4,060–4,070. This is where buyers need to prove strength, because rejection from this area may bring another pullback.
➤ Key levels
◌ 4,011: buy wave C zone and short-term support
◌ 4,027: current reaction area
◌ 4,038: nearest sell zone
◌ 4,060–4,070: Elliott completed zone and main resistance
◌ 3,985–3,990: lower support if wave C fails
◌ Above 4,070: area where recovery gains stronger quality
⌁ Elliott Wave view
From an Elliott Wave perspective, gold appears to have completed a bearish 5-wave move near the lower low. After that, the market is now building an ABC correction.
Wave A created the first rebound from the low.
Wave B pulled back into the current structure.
Wave C may develop from the 4,011 area if buyers defend support.
If wave C holds and price breaks above 4,038, gold may continue towards 4,060–4,070. However, if price fails to hold 4,011, the ABC recovery weakens and gold may retest the lower base again.
▸ Trading scenario
Preferred scenario: wait for price to hold the buy wave C zone and show bullish confirmation.
Entry zone: 4,011–4,020 if bullish confirmation appears
Stop loss: below the confirmed wave C low
Take profit 1: 4,038
Take profit 2: 4,060–4,070
Take profit 3: 4,090 if momentum expands
Alternative scenario: if gold breaks below 4,011 and fails to reclaim this area, the ABC structure loses quality. In that case, price may return towards 3,985–3,990 before forming a new base.
⌁ Kelly’s view
For Kelly, this is a short-term ABC recovery setup after a completed bearish Elliott wave. The market is no longer in clean sell momentum at the low, but buyers still need to confirm strength through resistance.
The cleaner plan is to watch the reaction around 4,011 first. If buyers defend this zone, gold may continue recovering towards the sell zones above.
Gold is forming an ABC rebound.
If wave C holds, the next move may continue towards 4,038 and 4,060.
Share your view below.
Long 
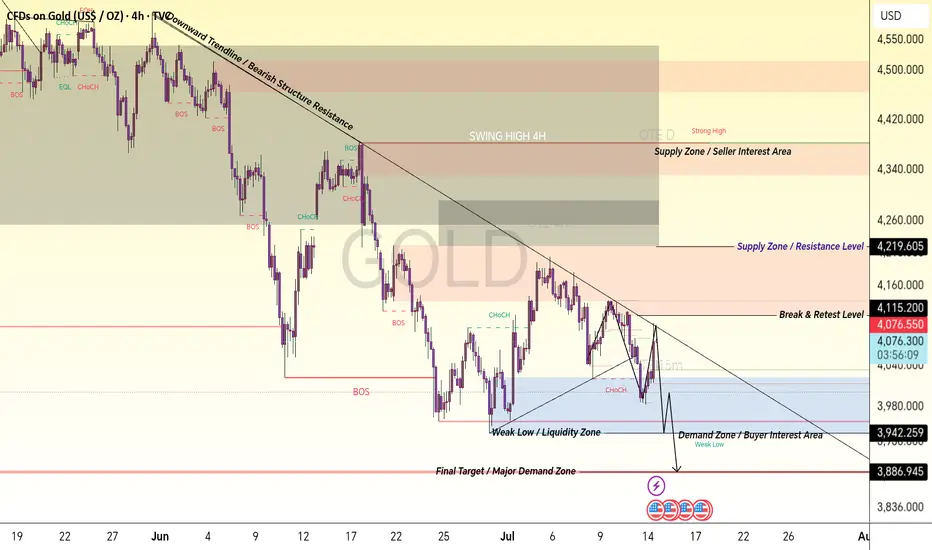
Gold 4H Market Structure Analysis | Bearish Trendline & Key zoneXAU/USD 4H Smart Money Concept Detailed Candle-by-Candle Analysis
Gold 4H chart is showing a complete market structure transition where every candle reflects the battle between buyers and sellers. The price started from higher levels with strong selling pressure after reaching the premium supply area. The early candles created rejection wicks, showing that sellers were defending the upper zone and preventing further upside continuation.
After the rejection from the high area, bearish candles started forming lower highs and lower lows. This sequence confirmed that sellers were gaining control. The first major Break of Structure (BOS) occurred when price broke previous swing lows, indicating a shift from bullish momentum into a bearish structure.
During the downward move, candles continued respecting the descending trendline, which acted as dynamic resistance. Each pullback candle toward this trendline showed weak buying strength, while rejection candles confirmed continuous seller interest. This created a clear bearish channel where smart money continued distributing positions.
After reaching the lower range, price formed a temporary recovery phase. Green bullish candles appeared as buyers entered from the demand area, creating a short-term Change of Character (CHoCH). However, the recovery failed to break the major supply zone, showing that buyers were not strong enough to reverse the overall trend.
The candles near the Supply Zone / Resistance Area showed hesitation and rejection. Multiple small-bodied candles indicated uncertainty, while bearish engulfing movements confirmed that sellers were still active. This area became a key reaction point for future price movement.
The next sequence of candles created another bearish leg, breaking previous support levels and confirming continuation of the downtrend. The strong bearish candles represented aggressive selling pressure, while small retracement candles showed weak attempts from buyers to regain control.
Near the Weak Low / Liquidity Zone, candles started moving sideways, indicating accumulation and liquidity building. The market created equal or nearby lows where stop liquidity may be resting. Smart money often targets these liquidity areas before making the next directional move.
The latest candles are showing reaction from the Demand Zone / Buyer Interest Area. Buyers are attempting to defend this region, but confirmation is required through a strong CHoCH or BOS before considering a complete reversal.
If price breaks below the demand zone, bearish continuation can target the Final Target / Major Demand Zone where stronger buying interest may appear. If buyers successfully defend the zone and break above resistance levels, price can move toward higher supply areas.
Complete Market Story:
Higher Timeframe: Bearish structure remains active.
Trendline: Sellers are controlling momentum below resistance.
Supply Zone: Main selling area and rejection point.
BOS: Confirms seller dominance.
Demand Zone: Buyer reaction area.
Liquidity Zone: Possible stop hunt area before next move.
Final Demand: Major area where institutional buyers may react.
This chart demonstrates Smart Money Concept analysis using market structure, liquidity, supply & demand, BOS, CHoCH, and trendline reactions to understand institutional price movement. Always wait for confirmation before entering any trade. Short 
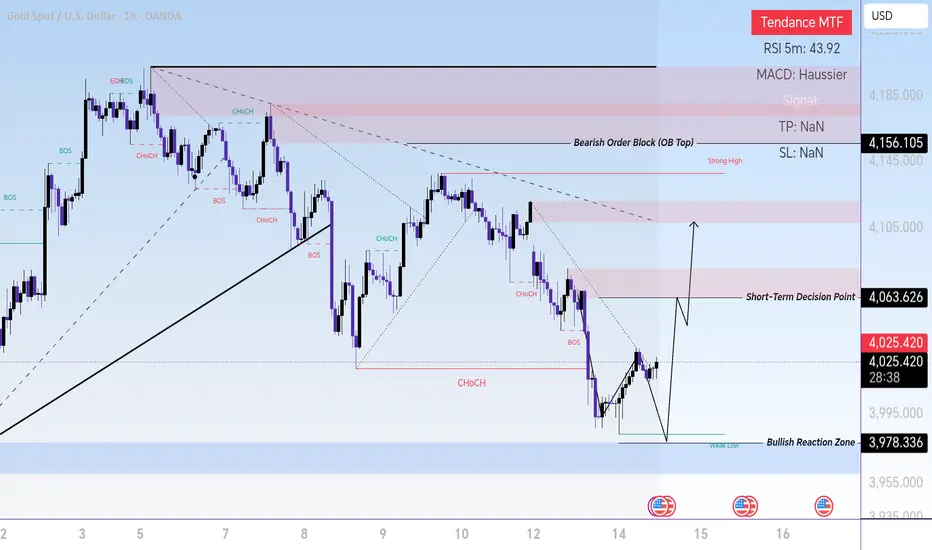
Gold Trading Setup | Order Flow, Supply & Demand AnalysisThis XAU/USD (Gold) 1H chart presents a complete Smart Money Concept (SMC) market structure analysis, explaining how every candle reflects the battle between buyers and sellers, liquidity movement, and institutional order flow.
The chart begins with a bullish phase where price creates higher highs and higher lows, showing buyer strength. As price reaches the upper liquidity area, EQH (Equal Highs) and Strong High formation indicate a potential liquidity pool where smart money may target resting orders.
After reaching the premium zone, sellers gain control and price starts forming lower highs and lower lows. Multiple BOS (Break of Structure) signals confirm bearish continuation, while CHoCH (Change of Character) highlights the shift from bullish momentum into a bearish structure.
Each candle around the supply area shows rejection and selling pressure, indicating institutional distribution. The descending movement confirms that sellers are defending higher price levels and pushing price toward lower liquidity zones.
The recent decline moves toward the Weak Low / Liquidity Zone near 3978, where sell-side liquidity is resting. This area can act as a potential reaction zone where smart money may collect liquidity before the next expansion.
The chart also highlights important decision areas:
Strong High: Major liquidity and resistance area
Supply Zone: Area of potential seller activity
CHoCH: Market direction shift confirmation
BOS: Continuation of existing structure
Weak Low: Liquidity target and possible reversal area
Demand Zone: Potential buyer reaction zone
If price successfully sweeps the weak low and shows bullish confirmation, a recovery toward 4063, 4120, and higher resistance zones may develop. However, failure to hold demand could continue the bearish structure.
This analysis is created for educational purposes, showing how professional traders study each candle through liquidity, market structure, order flow, BOS, CHoCH, and supply-demand concepts before making trading decisions. Long 
Education 
 Long
Long
Short 
XAUUSD: Selling Pressure Still Dominates After Weak ReboundGold is staging a technical rebound after the sharp decline, but it continues to trade below both the EMA34 and EMA89, showing that the bearish H4 trend has not changed. The current bounce is mainly corrective, as price has still failed to reclaim the $4,070–4,110 resistance zone, where sellers have repeatedly appeared in recent sessions.
From a fundamental perspective, gold remains under pressure as the US Dollar and Treasury yields stay elevated ahead of the US CPI inflation report. Markets expect this release to influence when the Federal Reserve may begin cutting interest rates, keeping capital cautious and limiting short-term demand for gold. If CPI comes in above expectations, the Dollar could strengthen and add further downside pressure on XAUUSD. Conversely, a softer-than-expected CPI reading would support a gold recovery.
On the H4 chart, sellers retain the advantage as long as price remains below the EMA89. If the $4,020 support is broken, XAUUSD could extend its decline toward the $3,980 area. Long 
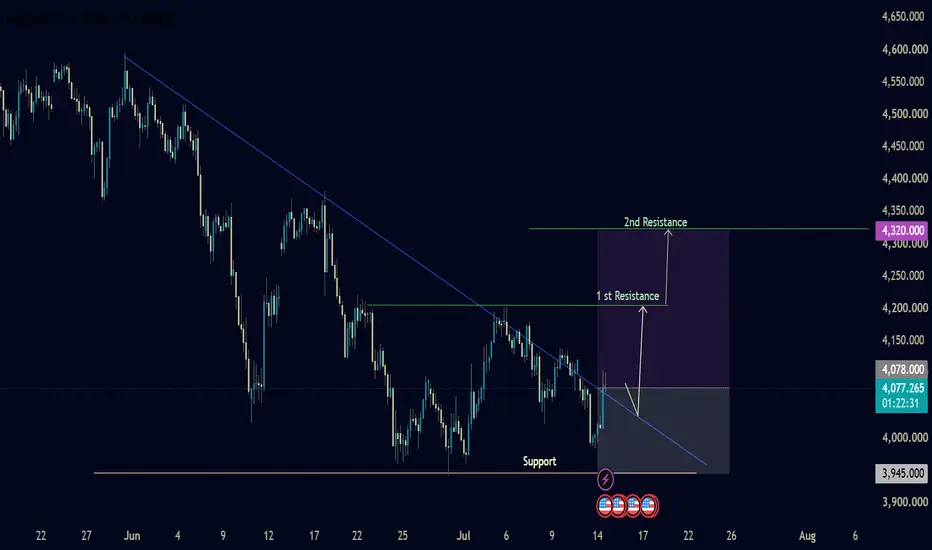
XAUUSD (Gold) – Trendline Breakout & ResistanceXAUUSD (Gold) – Trendline Breakout & Resistance Outlook
Gold is attempting to recover after finding strong buying interest near the established support zone. Price is now testing a descending trendline that has limited upside momentum over the past several sessions. A confirmed breakout above this trendline could signal the beginning of a stronger bullish phase.
Key Resistance Levels
Resistance 1: 4,191 – 4,221
Resistance 2: 4,329 – 4,335
Key Support Levels
Support 1: 4,020 – 4,076
Support 2: 3,945 – 3,932
The highlighted support region remains an important demand area where buyers have repeatedly stepped in. As long as price holds above this zone, the short-term outlook continues to favor further upside.
A decisive break above the descending trendline and the first resistance zone would strengthen bullish momentum and open the path toward the second resistance area. However, if price fails to maintain support, a deeper pullback toward the lower demand zone may develop before the next directional move.
As always, wait for confirmation before entering a trade and apply proper risk management during periods of increased volatility.
❤️ If you found this analysis helpful, please consider leaving a Like. Your support is greatly appreciated and motivates me to continue sharing high-quality market insights.
⸻
This version is written in a professional style, with different wording from the original while matching your chart’s bullish breakout setup. Long 
Short 
Long